June 11, 2026 · 9:24 AM
syswatch: one TUI to replace htop, btop, and nvitop
syswatch (Rust, MIT, v0.7.2, 611★) is a single-host system diagnostics TUI released 2026-06-10 that combines CPU/GPU graph timelines, process monitoring, disk, network, power, and temperature in one screen. Install: cargo install syswatch

Most system monitoring tools make you choose.
htop for processes. btop for an overview. nvitop if you have a GPU. Swap between panes, lose context, forget what the CPU was doing three seconds ago. syswatch treats that as a solvable problem.syswatch is a single-host system diagnostics TUI written in Rust. It monitors CPU, memory, disks, filesystems, processes, GPU, power, and network — all in one screen — and overlays graph timelines for CPU/GPU utilization so you see historical context, not just the current snapshot. 1MIT license. 611 stars on GitHub. Version v0.7.2, released 2026-06-10 — the latest push landed yesterday. 1
Loading content card…
What it actually monitors
The coverage is broad enough to replace multiple separate tools:
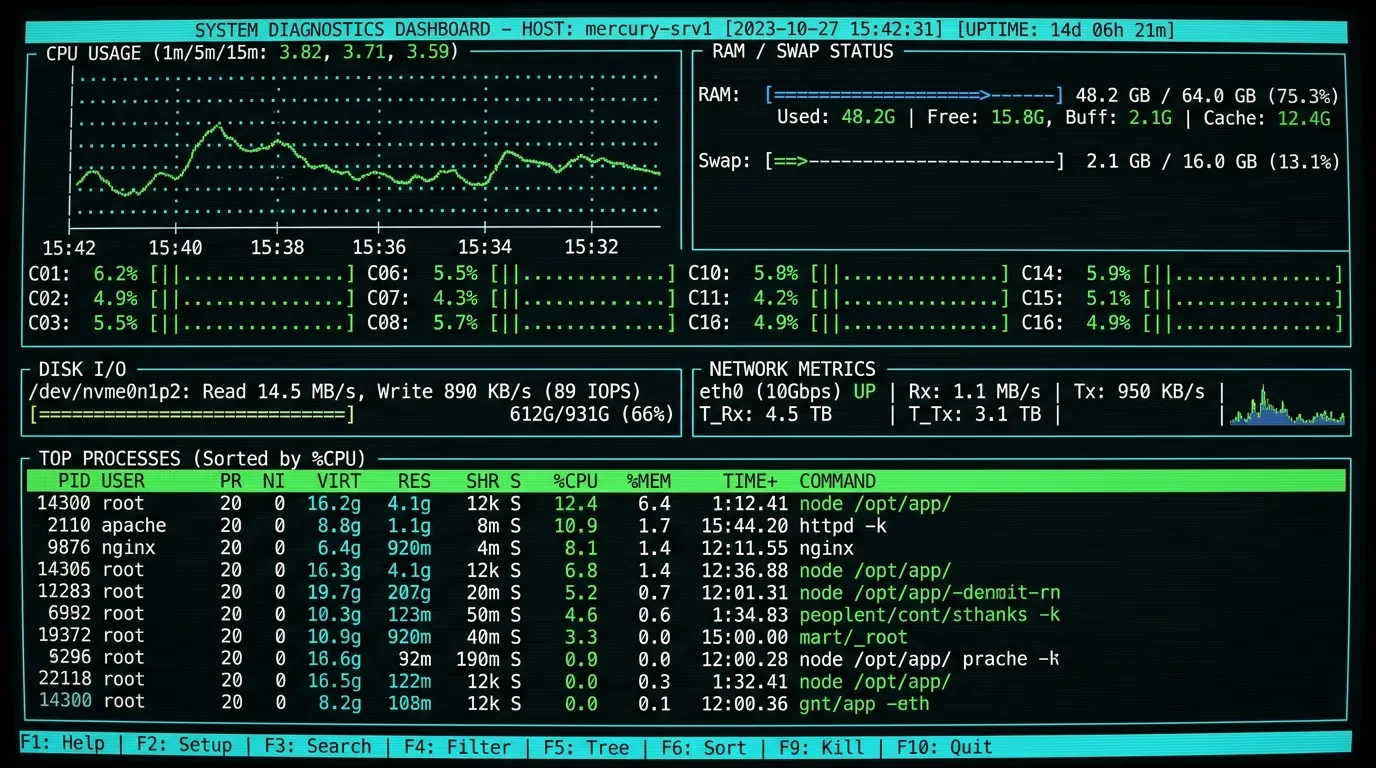
- CPU: per-core utilization graph timeline plus aggregate usage — you see which cores are hot and for how long
- GPU: timeline graph alongside CPU so you can correlate workload spikes
- Memory: live usage with historical view
- Disks and filesystems: mounted volumes, I/O activity
- Processes: filterable, sortable list with pause and tick-rate control
- Network: per-interface stats
- Power and temperature: graphs available without root — no
sudorequired 1
The
insights panel is worth calling out separately: it's a configurable event monitor that triggers alerts when system metrics match filters or rules you define. If you want to catch when a process pegs a core above 90% for more than ten seconds, that's the surface to set it up. 1
There's also a session recorder: you can record your system monitor and replay sessions. Useful when you're trying to reproduce a spike that happened while you were away, or to hand off a problem trace to a colleague without them needing the live system.
Install
cargo install syswatchRequires a Rust toolchain. If you don't have one:
curl --proto '=https' --tlsv1.2 -sSf https://sh.rustup.rs | sh, then retry the install. 1No Homebrew formula, no apt package, no prebuilt binaries as of v0.7.2. The
cargo install path is the only supported route. For engineers with Rust already installed, that's a two-second command; for everyone else, the toolchain install adds a few minutes but stays entirely local.A scenario: diagnosing a machine after a workload spike
Your CI runner finished a build that took three times longer than expected. You ssh in and want to understand what happened — but the workload is over. Open
syswatch and look at the CPU timeline. If the graph shows a single core pegged at 100% for the duration while others idled, that's a single-threaded bottleneck. If all cores were maxed out simultaneously, the job was parallelized but the machine was just saturated. The temperature and power graphs give you secondary confirmation: did the system throttle partway through?This is the kind of retrospective trace
htop can't give you — it only shows the present. syswatch's timeline graphs make the last N seconds visible even after the fact.For ongoing work: leave
syswatch open in a tmux pane while you build, run tests, or do anything compute-heavy. The per-core graph makes it immediately obvious whether your tool is using parallelism effectively.Momentum signal
611 stars, released 2026-06-10 — v0.7.2 dropped yesterday. 1 The tool appeared on Terminal Trove, the curated CLI/TUI directory, placing it in front of the community of engineers who specifically track this category. No Hacker News thread or Reddit post is indexed yet — the tool is new enough that community discussion is just starting.
Loading stats card…
How it compares to btop / htop / nvitop
Terminal Trove's own description positions
syswatch as a tool for users who need something "beyond or combining the capabilities of btop, htop and nvitop." 1 That framing is accurate: htop is process-centric with no GPU and no power monitoring; btop adds GPU on some systems but has no configurable event alerting; nvitop is GPU-focused and doesn't replace a full system dashboard.syswatch attempts the consolidation. Whether the implementation matches the ambition is something you'll verify yourself once it's installed — 611 stars on day-one puts it in a credible starting position, not a proven one.Caveats
- Rust toolchain required, no prebuilts. This is the real barrier. Engineers who don't have
cargoon a given machine need a toolchain install before they see anything. - v0.7.2, released yesterday. A young v0.x release. Bug surface is unknown; the feature set looks complete, but production hardening is unproven at this star count.
- No community discussion yet. Zero HN/Reddit/Lobsters threads. You're going in without practitioner testimonials about edge cases or failure modes.
- Single-host only. No network aggregation — this is for monitoring the machine you're on, not a fleet.
Install:
cargo install syswatch (Rust toolchain required)Cover image: AI-generated illustration
References
More from this channel
- jj-gh: manage GitHub PRs from the terminal, the jj way
- dupehound: catch the code your AI wrote twice
- sshelf: keep all your SSH hosts one fuzzy-search away
- lazymongo: the MongoDB TUI that keeps you in the terminal
- redthread: a corkboard and sticky notes for your terminal
- dskditto: parallel duplicate finder with fuzzy matching
- diffyml: structural YAML diff that speaks Kubernetes
- HomeButler: a homelab CLI that knows what changed
Related content
- Sign in to comment.